
If you’re submitting a search query like “Google Analytics for beginners,” you’re probably wanting to better understand your website’s performance and visitor behaviours.
Google Analytics offers tons of free insight you’ll likely need as a small business.
And although this much data can feel intimidating at first, I’m here to break down the basic metrics you’ll need to succeed in the early stages of your online business venture and beyond.
So where do you start? Your best strategy is to begin by:
- Installing Google Analytics
- Identifying the numbers you’d like to track
- Familiarizing yourself with the software
Alternatively, you may wish to have custom Google Analytics Reports created or have the basic analytic reports delivered via email. But in this post, I’ll start by discussing online resources you can use to get started with Google Analytics. Plus, review important key metrics in more detail.
How to install Google Analytics for beginners

If you don’t already have Google Analytics installed, the first thing you need to do is create your account.
Be aware that Google has recently launched Google Analytics 4 — its biggest advancement in a decade.
Google Analytics 4 is now the default version when setting up a new account.
Navigating this new update can be tricky and many people still prefer the older interface of Universal Analytics. You can learn more about the difference between the two here and determine which route makes the most sense for you.
If you decide to stick with Universal, you can refer to this guide to set that up. Otherwise follow the prompts and continue with the process.
Handy resources for your initial set up
Once your account is set up, your next step is to implement it on your website.
The process for this will be different depending on which Content Management System (CMS) you’re using. Here are some resources for the leading CMSs:
The final step is determining which reports you’d like to monitor for the most relevant insight on website performance. In the next section we’ll explore important metrics that are worth noting.
6 Google Analytics metrics to watch

When researching Google Analytics for beginners, it’s important to identify which metrics will be necessary for your business, and how often you will monitor them. This will ensure you maintain focus and boost your overall website performance.
Here are six metrics to keep an eye on when discussing Google Analytics for beginners:
1. Users
It’s important you understand the distinction between Users and Sessions when browsing metrics in your Google Analytics reports.
Users
The is the number of unique visitors that visited a site (unique means not the same people visiting the site multiple times).
Sessions
This refers to the different number of times a particular user frequented the website.
For example, imagine you visit a website three times in two days. Google Analytics will record one user but three sessions within the reports.
You may eventually prefer to monitor Sessions rather than Users. But for me, I like to bring the data back to people.
How to find the Users report
You can find the Users report by navigating to Audience > Overview.
Within this report, you’ll notice two sub-categories that are labelled “Users” and “New Users.” The latter is the number of people who have visited the website for the first time in the specified time frame.
2. Pages per session
This is a great metric to monitor in combination with Users, since it gives you a quick snapshot of engagement.
This metric tells you how useful your web content is to your visitors.
Let’s say you have visited three times browsing two pages in the first session, four pages in the second session, and three pages in that last session. The formula would look like:
9 total page views / 3 total sessions = 3 average pages per session
In this example, you can see that by taking the total number of Page Views and dividing it by the total number of Sessions will result in the average Pages Per Session.
This is the same formula Google Analytics uses when recording Pages Per Session and can be applied to a much larger scale, depending on how much traffic your website brings in.
How to find the Pages Per Session report
You can find Pages Per Session by navigating to Audience > Overview.
It’s a great indicator of how engaging or useful the user finds your site. But be mindful — if the pages per session creeps too high, it could be an indication that the people are struggling to find the information they are looking for.
Beyond that, you should look at how each device and traffic source influences Pages Per Session. It may help to identify any issues with your website performance or indicate if the traffic coming from a particular source is low-quality.
3. All traffic
Anyone interested in Google Analytics for beginners wants to know where their traffic is coming from, right?
Depending on how specific you want to get, Google Analytics has plenty of options. You can view the broader results using Channels or drill down more specifically with the Source/Medium report.
- Channels will give you source information using top-level categories like Organic Search, Direct, Referral, and Social. These four categories will help you determine which mediums people are entering your site by.
- Source/Medium will give you the same channel information but drill down even further by providing specific sites that are referring traffic your way.
The main distinction is that Channels will lump all your traffic sources together within the four categories, while Source/Medium shows specific links and websites that are linking to your site.
How to find the Channels and Source/Medium reports
You can find the Channels report by navigating to Acquisitions > All Traffic > Channels. You can view the Source/Medium report by navigating to Acquisitions > All Traffic > Source/Medium.
Identifying how users are finding your website will allow you to understand which marketing methods are working well. It can also help you determine which traffic sources don’t have enough traffic, indicating you need to invest more … say, in social media posts that link to your site.
4. All Pages
A big part of understanding how people interact with your site is knowing which pages they are looking at.
The All Pages report shows your user engagement metrics which can be used to improve your pages.
There are several things to consider within this report. Some examples include:
- Page Views and Unique Page Views. The former shows how many times the page has been viewed, while the latter shows how many different users have viewed the page.
- The average time on page. This tells you how engaged users were within a specific page. Pages with really useful or interesting content will have higher average time on page than those with little of interest.
- Exit rate. This shows you how many people left your site from a specific page. Each page should be different. For example, you would expect the Contact page to have a high exit rate because contact details are quick to absorb.
- Top pages. Look for any surprises in the top pages to see if anything stands out. Make sure you’re aware of how those pages influence the experience people are having on your site.
Equipping yourself with this knowledge can help you build your website performance based on user behaviours.
Related: 10 steps for an annual website review
How to find the All Pages report
You can locate the All Pages report by navigating to Behaviour > Site Content > All Pages.
Take the analysis a step further and click on the dropdown menu titled, “Secondary Dimension.” Then, select “Source/Medium” to discover which traffic sources bring the most people to each of the pages.
5. Location
This metric is about segmenting how potential customers can use your website to get a better understanding of your business, based on where they are located.
If your business serves customers globally, this can lead to great insights about where to focus your regional marketing efforts.
Key insights
This report allows you to zero in on location segments by state, province, or even city to see which areas are sending your site the most traffic. Some will perform better naturally, but it’s a good way to discover regions you might not have considered are bringing in traffic from different sources.
On the other hand, you might find that regions outside your business operations could distort the metrics displayed in Google Analytics.
For example, if you only operate out of Melbourne but your blog posts are read by visitors all over Australia, you might be getting site traffic from users that are never going to be a potential customer.
Note: Targeting customers outside of your business operations isn’t necessarily a bad thing. It might just be a new opportunity you can consider expanding into later.
Related: How to add an e-commerce shop to your brick-and-mortar business
How to find the Location report
You can find information on your visitors’ geographic location by navigating to Audience > Geo > Location.
6. Mobile overview
Mobile web traffic is the leading source of traffic these days, which is why it’s an important number for many small business owners to know.
This report not only helps you understand the user website experience for mobile, but across all devices as well.
You can even take it a step further by identifying how each device influences metrics such as:
- Pages Per Session
- Session Duration
- Conversions
Ideally, your website performance should be easy to use on any device — smartphone, tablet or desktop.
How to find the mobile overview report
Find the Mobile Overview report by navigating to Audience > Mobile > Overview.
Bonus metric reports to consider
The two reports below provide advanced data insights if you a have little more time to dedicate to the set-up process.
Both can provide valuable insight once you’re ready to advance beyond Google Analytics for beginners.
Conversions
Ultimately, what matters is how many people you are able to convert from casual browsers to customers. Many online business owners utilize this report to see:
- How many leads they are gaining or sales they are making
- Where their users are coming from
- What is influencing their target audience
To add this report to your own Google Analytics dashboard, you’ll need to first configure a Goal in your account. The most basic goal setup will involve a destination URL, which triggers a Goal or Conversion any time someone lands on that specific link.
This can be used for a few different scenarios, including:
- Contact forms: If your goal is to generate online enquiries via a contact form, then ensure the user is redirected to a thank you page when they’ve submitted their request. This URL can trigger Google Analytics to record it as a Goal, which will allow you to keep track of the number of people completing the form.
- Completed transactions: If you are an e-commerce store, you can also keep track of completed transactions. Simply use the URL customers are redirected to once their payment has been processed to trigger a Conversion on Google Analytics.
At some stage, e-commerce store owners may want to track even more advanced shopping behaviours using Ecommerce Tracking. This post by OptinMonster is a great resource to walk you through the process of setting up your Goal/Conversion reports.
Site search
If you have a search box on your site, then setting up Google Analytics to monitor this behaviour can be a gold mine.
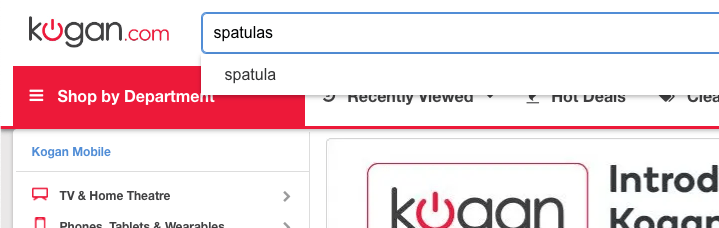
Some of the things it can help you identify, include:
- Design or navigational issues. Check to see if common search queries on your site lead to the right destinations. Fixing any errors will help boost user experience and increase your conversion rates.
- New products or services to offer. Site searches are a great tool to help with inspiration for products or services. Don’t currently have what they’re looking for? Start offering it!
- Preferred user language. Knowing what words your customers use the most will help you alter the text on your site to sound like more like them. It could also improve your search engine rankings.
If you need more help setting up site search in Google Analytics, check out this detailed guide from Google support.
Pushing beyond Google Analytics for beginners
I firmly believe that Google Analytics is one of the key tools that can help you bridge the divide between your small business and the bigger competitors.
It gives you the information to better understand your customers and what they’re searching for. It also provides insight on your overall website performance.
- A steady increase in sessions means you’re bringing more people to your site
- An increase in conversions means you’re doing a good job of convincing them to buy.
As a small business owner, you know your customers best, and you have a powerful way to give them a better user experience on your website.
So don’t be intimidated by Google Analytics. Continue to learn and navigate the data available to evolve your knowledge.